Telematics system consists of many interfaces to vehicle side and external systems. There are many external systems and sensors data required to be transmitted to central server/cloud for providing customer centric features and for correlation with vehicle parameters/analytics for example: Driver state monitoring systems(DSMS), Tire pressure monitoring system(TPMS). The major two links involved by the central processor in telematics unit-TCU is vehicle side link and gsm network link. There are many design considerations essential to make vehicle side, network side work seamlessly considering many challenges in wireless networks and as well in vehicle CAN communications. The system should have capability for developers, aftermarket team to debug the system components and links and further also should have essential log files/packet data files for the subject matter experts to analyze the faults remotely and avoid the downtime of the system.
Generic Connected Car Architecture and System Debugging points is shown below in figure-1
- Vehicle Side Interface – J1939/69, ISO 14229-UDS CAN Interface, RS-232/485, GPIOs, USB/Ethernet.
- Modem Interface with Network: GSM/GPRS-2G/3G/4G/5G Modem Interface to network
- GSM network interface to Internet gateway-source and destination communication and Security layer checks
- Server data packet communication logs

Figure.1 Generic Connected Vehicle Architecture and system debugging points
- Vehicle Side Interfaces: As number of features are getting added in cars/commercial vehicles-CVs many communication interfaces are added to telematics unit as well. Major system interface based on CAN communication with related standards. The CAN parameters and diagnostics trouble codes with variable cycle frequency from various ECUs exists which is scanned by the telematics unit at fixed durations and transferred to the cloud/server. The data acquisition in TCU is very important step and needs debugging of same through “candump” type of(Linux) commands. The values in candump need to be stored along with timestamp and printed on serial port for comparison with the data out from the TCU. The CAN log files can be captured during validation stages and run on the CAN simulators/tools and compared against the TCU log files for data comparison. Further the timestamp of the parameters in CAN logs vs TCU logs vs server logs should be done to make system data correct along with any data anomaly corrections to be done. Below figure 2 shows
This will ensure correctness of the data that has been captured and the sent to remote server.
Apart from vehicle CAN many external systems send data to TCU through various ports like RS-232, RS-485, USB etc. The node IDs of the interfaces along with parameter value and timestamp needs to be print and logged in memory and needs to be compared with server captured data with timestamp. Similar approach needs to be followed for any wireless sensor links like bluetooth, wifi. The system logs-A values can be compared with data out –B which is modem out packets compared at modem output and further at server end. The data captured in system logs –A should be equal or approximately equal to parameters captured value as sampling frequency can be different.

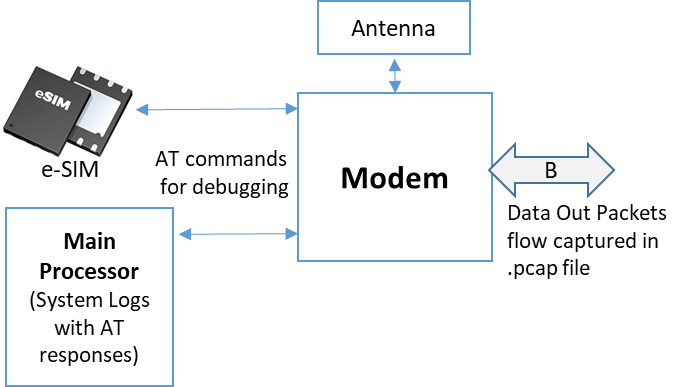
- Modem Interface with Network: TCU comprises of modem along with SIM/e-SIM and antenna which provides GSM/GPRS communication with 2G/3G/4G/5G network support. Figure 3 shows major modem interfaces and debugging points through log files. Most of latest generation TCUs support lot of debugging capabilities including packet data capture at output port, logging communication between SIM, Modem and Main processor through serial port. The packet data communication from modem can be captured in .pcap/supported network debugging tools file format for in depth analysis and trace the issue in network path. The entire communication between every nodes needs to be logged in system log file along with timestamp to trace the exceptions if any during communication.
The 3GPP (3rd Generation Partnership Project) Gsm communication standards provides various communication commands/methods which is used to send the data over mobile network. The request response communication for major AT commands used in code should be logged in system log file. This will provide information regarding the successful/unsuccessful packet/sms/call communication. Also for each AT commands the exceptions/error code are provided which needs to be handled by modem firmware or in the application software layer as per requirement. Exception commands like AT+CMEE? (Error codes) needs to be executed for detail information on the errors between TCU modem and mobile network.
For example: Response from network >> +CME =532 //corresponds to “SIM not ready”
Such responses need to be stored for debugging any network issue happened during the vehicle trip duration. These commands can be executed from remote server/web application (admin rights) through SMS or IP channel for debugging. Remotely issued debugging AT commands can give many useful information related to SIM and internet communication profiles such as SIM registration status(AT+CREG?), data packet info (AT+CGREG?), established socket information (AT^SISO?) etc. Same established IP channel can also be used to pass other commands to change device related configurations such as update rate of packets, device sleep time, Info about I/O terminals etc.
The data packet constructed by modem needs to captured at modem output in. pcap/equivalent files for debugging. Figure 4 shows sample .pcap file which can be viewed in Wireshark network monitoring tool. The packet size should be optimized to have seamless data transfer till server. There are many ways by which data packets can constructed as per sampling frequency, FMS –fleet management system application requirements, network constraints, platform/ server architecture-streaming etc. The modem data packet logged in file will provide information about data flowing through OSI model (Open System Interconnection model).
For example, One can understand the issues in three way TCP handshake and related errors like server reset and equivalent timeout adjustments at source and destination (platform/load balancers). Also the security layer TLS data flow and equivalent errors can be observed at corrected.

- GSM Network Interface to Internet Gateway: The mobile communication architecture consists of many nodes including RF interface – BTS, BSC, MSC, HLR, VLR, Internet gateway etc. Packet data passes through each nodes gets translated into equivalent network protocols like BGP (Border Gateway Protocol), GTP (GPRS Tunneling protocol) etc. Mobile network operators provide customized private APN for M2M SIMs for every organization. This restricts data packet from the TCU devices to be restricted to specified URLs/IP whitelisted at network firewall/filtering devices. The network firewall/filtering device. pcap logs can be enabled during validation trials/issue resolution analysis. Network logs provides DNS-Domain Name System communication info as well as information about source IPs and destination server IPs used in communication and many other useful information about network. The network provides static/dynamic source IPs (as per the selected SIM configuration by organization) to TCUs on which the communication happens with destination server IPs. However, DNS system provides end IPs as destination server IPs. These data packet logs are similar to figure 4 however the source and destination in each stage will be different. IP assigned to devices will not visible in the server side logs because this is a private IP provided by the network operator. In server side communication only public IPs will reflect which are commonly known as Natted IPs. NAT (Network address translation) is a protocol which map multiple local private IPs to a single public IP before transferring the information. In Case if data packets logs are captured at filtering device source is from network and destination is DNS resolved server IPs
- Server Data Packet Communication logs: The cloud server will receive the packets from the internet gateway. Normally these are received by load balancers at cloud end. The debugging data packet communication can be logged in .pcap file during validation/required trials/system debugging. The source IP received at server node is NAT IPs for security and destination IPs as end server ones. The data communication provides important information about server resets, source disconnection, network disconnection information required to understand how system performs with different data packet/file communication and accordingly source and destination sync up can be performed like timeouts adjustments at server end. Further data communication between load balancer to web application server, enterprise servers (ERP/SAP/ EAM/etc.) can be tapped in similar way to check the packet flow, load /stress analysis, security threats/issues.
End to End System Debugging: The suggested data packet logs can be enabled at major nodes mentioned in the architecture to provide end to end debugging with various log files mentioned above to design and develop effective end to end connected vehicles platform. There should be mechanism to get TCU system log files over the air (Logs Over the Air) for system traces at any given point of time. This requires logs to be captured simultaneously at each node and study the packet and vehicle CAN communication with TCU system logs traces with timestamp. However data packet logs .pcap logs can be enabled during validation stages and if any issue persist with specific TCU/network channel as required. This will provide necessary information for the SMEs (subject matter experts) to get into the network layer communication (TCP/UDP/HTTP/TLS etc.) details and resolve the issues from the field effectively with proper root cause analysis The suggested debugging methodology will provide better communication insights throughout the path and resolves any errors by taking corrective actions on affected nodes/links.
Author:

Pramod Prakash Jagtap
DGM
Volvo Eicher Commercial Vehicles-VECV
Pramod had done Masters in Electronics with 18 years of experience in Embedded system, IOT, mobile networks and wireless communications and worked in multiple domains. He currently heads connected vehicles onboard systems in VECV. He is passionate about IOT systems and platforms, Edge processing and analytics, RTOS, hardware and software security. He likes to play cricket, travel, listen music.
Published in Telematics Wire