Insurance companies cannot rely on traditional data mining technology to analyze all of this new data. Due to the sheer size of telematics data, insurers must consider a distributed, in-memory environment to display the results of data exploration and analysis in a way that is meaningful but not overwhelming.
Stuart Rose, Global Insurance Marketing Manager | SAS
Insurance companies talk about new product development and speed to market, but true innovation is rare in the insurance sector. However, telematics could be one technology to revolutionize the industry.
In an industry that’s frequently slow to adopt cutting-edge technologies, telematics is starting to make waves. And for those driving the adoption, it’s been a boon to their bottom line. Progressive Insurance was the first to implement telematics more than a decade ago; in 2014, the company reported that it wrote more than $2 billion in premium revenue for usage-based insurance policies. By 2020, consulting group, Ptolemus, projects that more than a quarter of US and Canadian auto insurance premium revenue will be generated via telematics, representing over $30 billion.

Since the origins of telematics almost everything has changed. From a technology perspective, the size and cost of the devices have decreased dramatically, and Wi-Fi and wireless communications make it more efficient to transmit the data. However, what has not changed is that the majority of telematics programs have been focused on data transmission and data collection.
To navigate and complete the telematics journey, insurers must visit three destinations – data management, data analysis and customer experience.
First destination: Data management
Big data has become a technology buzzword, and it is at the heart of telematics. First of all, let’s consider the amount of data that automotive telematics devices are expected to generate. A telematics device will produce a data record every second. This data record will include information such as date, time, speed, longitude, latitude, acceleration or deceleration (g-force), cumulative mileage and fuel consumption. Depending on the frequency and length of the trips, these data records or data sets can represent up to 1Gb of data per day, per vehicle!
To store this data, many insurance companies use distributed processing technologies such as the Hadoop file system. Hadoop is an open-source software framework for running applications on a large cluster of commodity hardware. Since Hadoop runs on commodity hardware that scales out easily and quickly, organizations are now able to store and archive a lot more data at a much lower cost.
There’s also a question about how much data is required to have a statistically meaningful data set to analyze. Experts forecast that insurers will need to collect at least 10,000 customer-years of data to correlate driving behavior with claims data so they can compare this information with data from standard drivers. Progressive Insurance recently reported that it had collected over 10 billion miles of data since it began its telematics program.
To help insurance companies address the challenges from large data volumes generated by telematics programs, it is essential for auto insurers to implement an enterprise data management strategy. This data management strategy should provide a unified environment of solutions, tools, methodologies and workflows for managing telematics data as a core asset. It should also be flexible and scalable to reduce the time and effort required to filter, aggregate and structure the exponential growth in telematics data.
Second destination: Data analysis
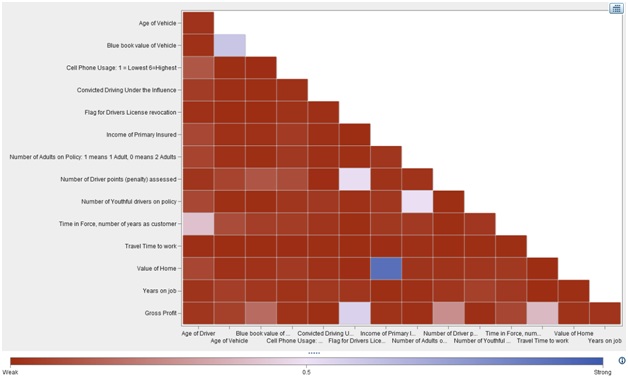
With all this new data that’s available through telematics, how do insurers determine which variables are predictive or can forecast driving behavior, claims experience, etc.? The next stop of the telematics journey is data analysis.
The challenge is how to filter the noise from the signal. Adding a new variable increases the number of data points and relationships exponentially. For example, in a very simplistic model, if you are testing for relationships among any five variables, there are 10 two-way tests to run, shown in the equation (5×4)/2 = 10. If you double the number of variables to 10, you more than quadruple the number of relationships to test, shown by (10×9)/2 = 45. With telematics devices adding dozens, if not hundreds, of new variables, this creates the potential to analyze millions of relationships.
That’s big data analytics! The problem is that many of those relationships may be redundant or trivial, and hidden among them are the “real nuggets,” or “signals.”
The science of extracting insight from data is constantly evolving. Tools are more readily available, and industries are beginning to invest in the technology that supports big data. By using data exploration and analytics, insurers will be able to rank and weigh hundreds of new variables to develop highly accurate telematics pricing models based on a driver’s past and forecasted driving behavior.
Insurance companies cannot rely on traditional data mining technology to analyze all of this new data. Due to the sheer size of telematics data, insurers must consider a distributed, in-memory environment to display the results of data exploration and analysis in a way that is meaningful but not overwhelming.
Final destination: Customer experience
Auto insurance is a highly competitive industry, and profitability is often eroded by pricing not tightly aligned with individual risk.
Telematics equips insurers with the ability to present information on individual driving behavior, which gives the customer an incentive to drive more safely. This information can be presented through a driving performance dashboard and key performance indicators (KPIs).For example, UK insurer Young Marmalade sends email alerts to the driver when a risk indicator changes colors from amber to red.
To further differentiate themselves, companies are building value-added services within their telematics programs. Telematics-equipped vehicles open up a plethora of potential services that can be delivered to the occupants of a car. These services include vehicle recovery and breakdown services.
Even though usage-based insurance thus far has been largely driven by personal lines markets, the companies that have implemented telematics in their commercial fleets have seen immediate decreases in claims volumes and fuel consumption.
Telematics offers a multitude of possibilities in the way auto insurance could be priced. Telematics enables insurers to use real-time data for real-time pricing. Of course, the idea of using this data to generate personalized pricing and provide meaningful risk information appears simple. In reality, it is very complex– and it requires high-performance analytics. The velocity of big data coming into an organization, especially dataarising from telematics, can be very difficult to manage. The ability to quickly access and process varying velocities of data is critical. Insurance companies should consider a “stream it, score it, store it” approach. This approach enables analytics to be applied on the front end to first sift out the meaningful telematics data from the unimportant data, or the “noise.”
Moving forward with telematics
Telematics has the power to transform the vehicle insurance industry and deliver significant competitive advantages to early adopters. But with this great potential also comes complexity. Advanced high-performance analytics and big data tools can assist companies in overcoming the complexities, thereby enabling them to reach the full potential of telematics as it grows from a trend to a must-have for all insurers.